


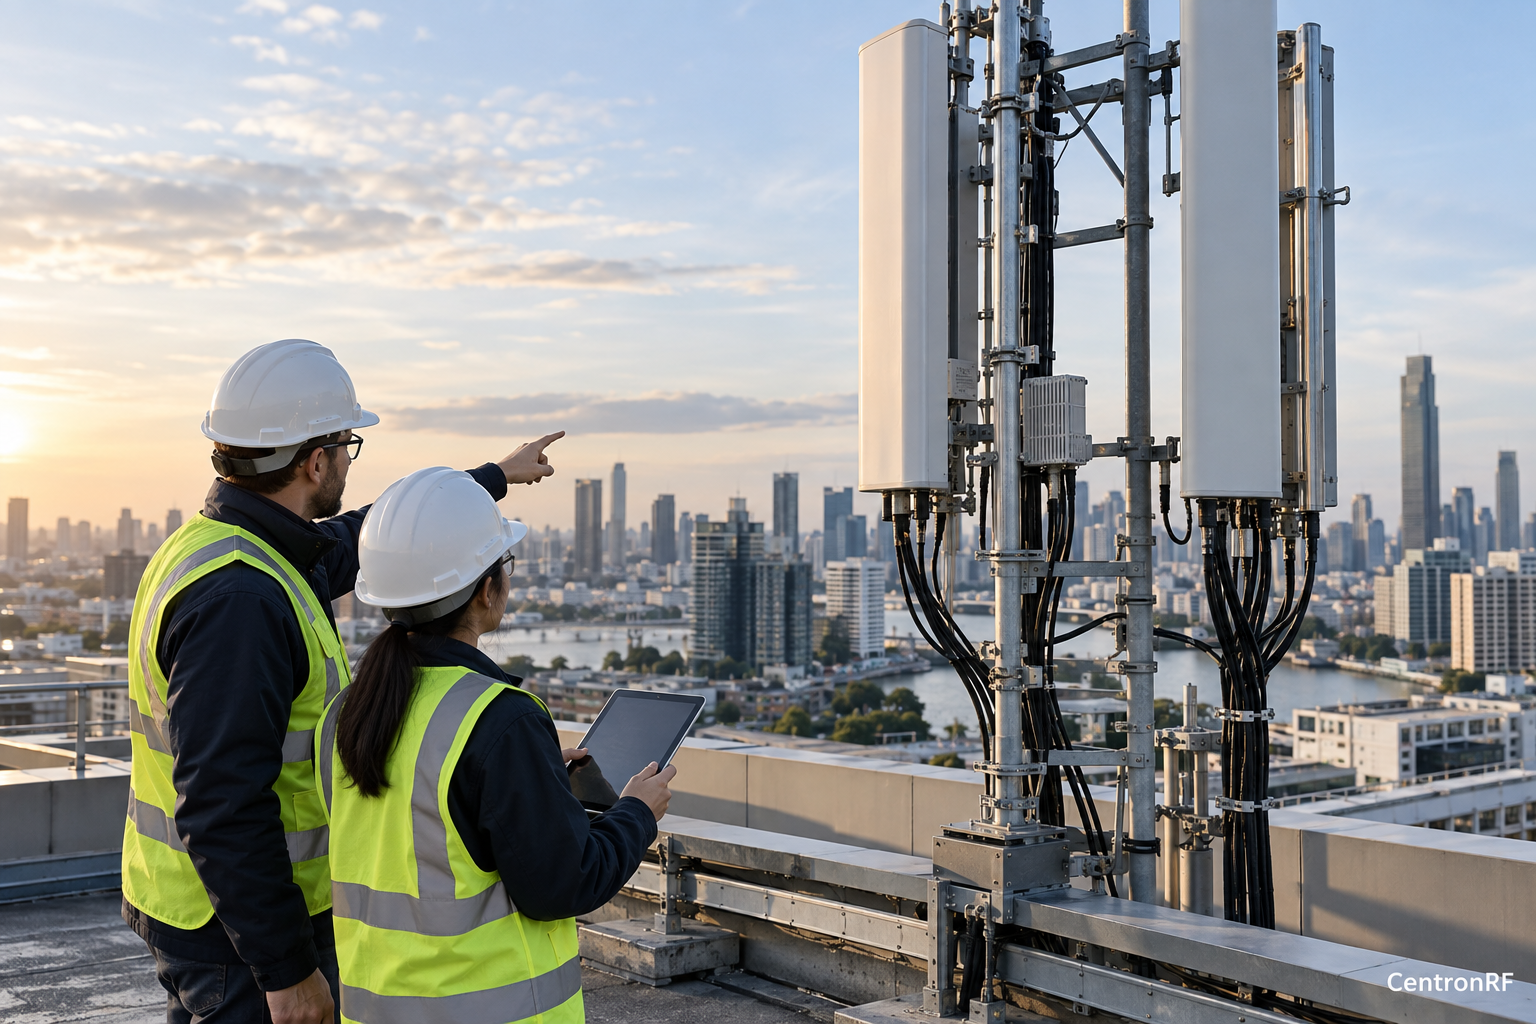
Carrier aggregation testing requires a path rated across every active carrier and the measurement bands around them. A component selected for one carrier may be inadequate for the combination.
Why this matters in the industry
Multi-carrier configurations can spread energy across a broader frequency interval and increase total power. Both passband coverage and loading need reassessment when enabling another carrier.
The technical reasoning
Carrier aggregation changes the frequency and power scope of the experiment. Multiple occupied bands may stress a route differently from one carrier, and total power depends on simultaneous signal conditions. A correction derived at one carrier cannot describe widely separated carriers without supporting characterization.
Frequency coverage is a system property
A complete RF route has a frequency response, not a single universal loss. Its usable range depends on every stage, connector, coupling structure and measurement method. A test can include frequencies beyond the main carrier: harmonics, neighboring channels, converted signals or multiple simultaneous carriers. Amplitude flatness and phase behavior may also matter within the nominal passband. Checking only the center frequency can miss a route feature that biases a wideband result.
How to structure the investigation
Create a table of carrier edges, power levels and measurement offsets. Evaluate the union of those spans against each accessory's specifications. Sum powers in linear units before converting the total to dBm, and measure response where carriers are widely separated.
Draw the frequency plan and list the minimum and maximum measured frequencies at every conversion stage. Characterize relevant transmission and reflection over that span using an appropriate grid. Use enough points to resolve meaningful variations and compare edge behavior with the intended measurement bandwidth. A converter's gain does not remove the need to assess the paths before and after it. Store separate corrections for routes whose bands or states differ.
Worked example or engineering scenario
Two independent equal-power carriers at 20 dBm each have a combined average power of about 23.01 dBm. Their occupied edges and any intermodulation measurements still require a separate frequency-plan review.
Evidence to collect
| Record | Purpose |
|---|---|
| List all carriers | Defines the tested state and scope of the comparison. |
| Include occupied edges | Makes the stimulus or route condition reproducible. |
| Sum linear power | Supports interpretation of variation and possible confounding effects. |
| Check broadband loss | Connects the observation with the stated engineering decision. |
Trade-offs and common interpretation errors
Do not extend a documented range because the connectors fit or the technology has a broad label. Likewise, a sparse sweep can miss a narrow feature. When the test moves to another band, review instrument settings, route response and the definition of the reported result before reusing an older correction file.
What the result can support
Define both the complete occupied spectrum and the composite waveform before interpreting aggregated-radio results.
Do not add dBm values arithmetically to obtain total RF power.
Further technical reading
Related industry knowledge
- Protecting a Test Receiver from an Unexpected Cellular Uplink
- Distributed Antenna Systems: Measuring Passive Path Loss
Numerical scenarios are illustrative assumptions, not reported measurements of a supplied product or installation.