


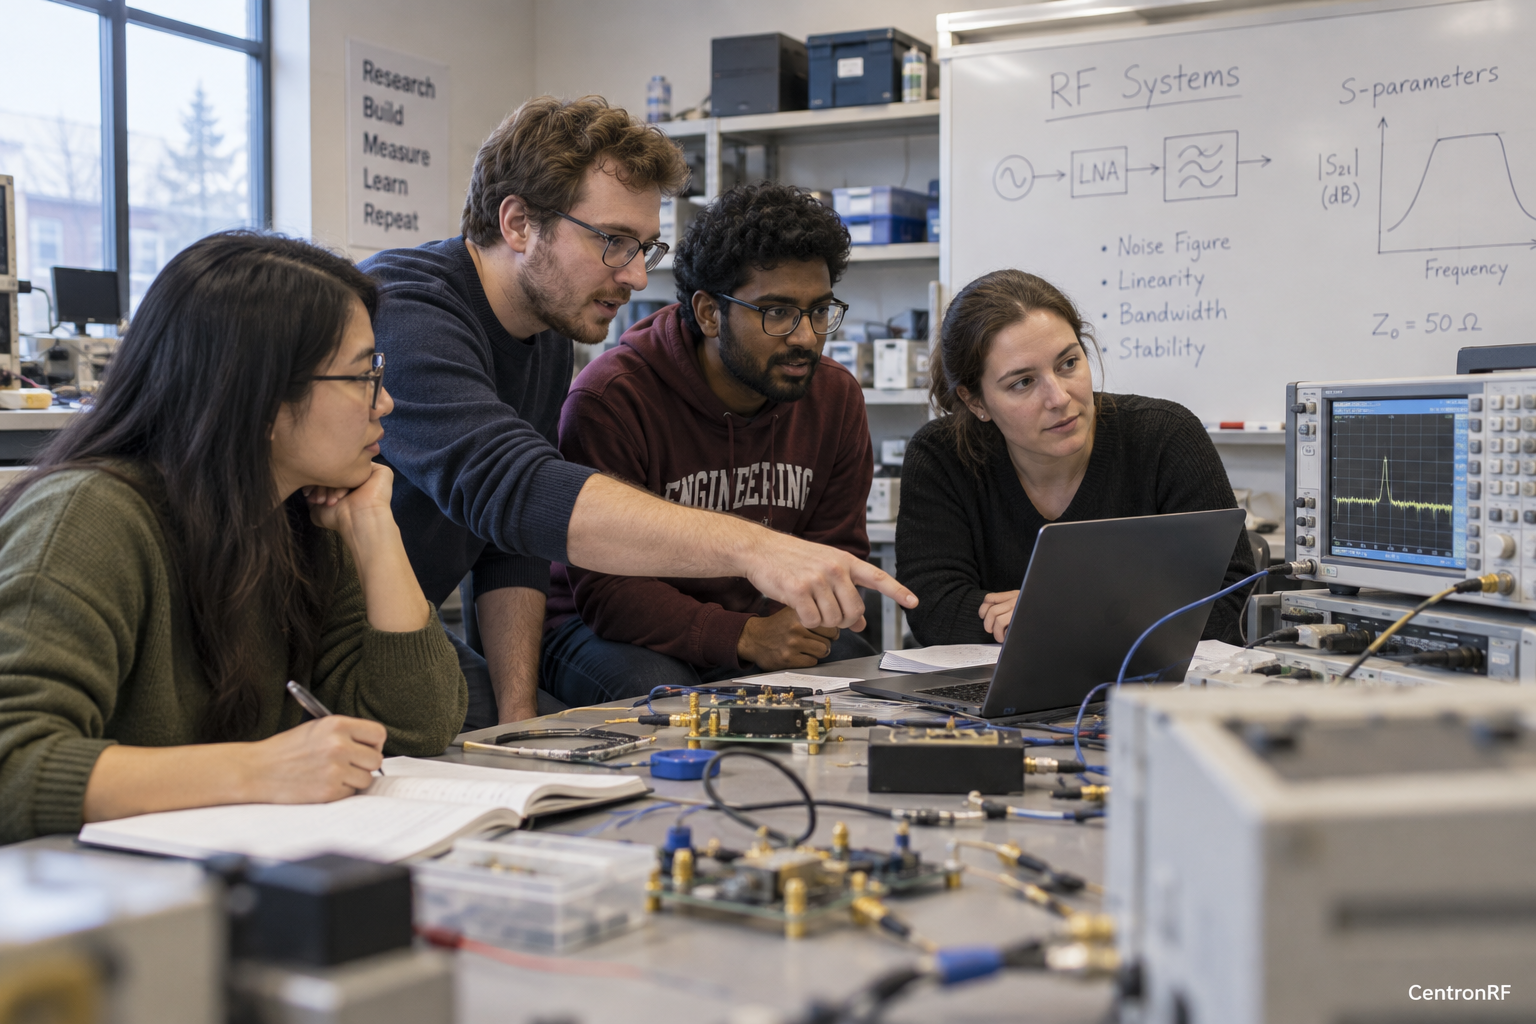
Software-defined radio experiments need accessories matched to the SDR's supported interfaces, bands and input-output limits.
Why this matters in the industry
Teaching teams use SDRs for varied exercises whose requirements can differ between receive and transmit operation.
The technical reasoning
SDR exercises combine analog RF limits with sampling and digital processing. The selected sample rate, bandwidth, gain state and numerical normalization affect what students observe. A strong analog input can overload before software processing, while an apparent digital spectrum feature can arise from sampling or processing rather than an external emitter.
Why the waveform changes the engineering question
A modulated signal cannot be described completely by one carrier-power number. Its occupied bandwidth, crest factor, time structure and receiver processing affect which impairments are visible. For example, an OFDM waveform can have peaks substantially above its average power, while a burst transmission may contain idle intervals. Measurements therefore need a defined observation window and an operating state. Average level, peak level and in-burst level answer different questions and should not be substituted for one another.
How to structure the investigation
Check the exact SDR specifications and selected operating mode. Characterize pads, cables and any bias path to the defined plane. Record software settings and gain stages, then verify levels before comparing captured data with an ideal signal model.
Keep the waveform configuration fixed during comparisons: bandwidth, modulation, active carriers, timing and payload or resource allocation as applicable. Measure the relevant signal under those settings and inspect the instrument's usable range. A path that is adequate for a continuous tone may not preserve a wideband or intermittent waveform. Capture configuration alongside results and repeat after a change that affects spectral or temporal behavior.
Worked example or engineering scenario
A signal beyond the intended sampled band can appear at an aliased frequency if the analog filtering and sampling model permit it. Changing the display span does not remove the underlying sampling issue.
Evidence to collect
| Record | Purpose |
|---|---|
| SDR mode | Defines the tested state and scope of the comparison. |
| Gain settings | Makes the stimulus or route condition reproducible. |
| Input-output limits | Supports interpretation of variation and possible confounding effects. |
| Path correction | Connects the observation with the stated engineering decision. |
Trade-offs and common interpretation errors
A headline power or bandwidth value can hide the condition that causes failure. Look for clipping, settling, thermal change or an unsuitable capture window. An apparent improvement can come from changing the measurement setup rather than the radio, so confirm the interpretation with a controlled comparison.
What the result can support
Connect analog route conditions with sampling and processing assumptions before interpreting the displayed spectrum.
A passive accessory does not validate the SDR's complete sampling or calibration behavior.
Further technical reading
Related industry knowledge
Numerical scenarios are illustrative assumptions, not reported measurements of a supplied product or installation.